4.5 KiB
Use the Agent with Netdata Cloud
While the Netdata Agent is an enormously powerful distributed health monitoring and performance troubleshooting tool, many of its users need to monitor dozens or hundreds of systems at the same time. That's why we built Netdata Cloud, a hosted web interface that gives you real-time visibility into your entire infrastructure.
There are two main ways to use your Agent(s) with Netdata Cloud. You can use both these methods simultaneously, or just one, based on your needs:
- Use Netdata Cloud's web interface for monitoring an entire infrastructure, with any number of Agents, in one centralized dashboard.
- Use Visited nodes to quickly navigate between the dashboards of nodes you've recently visited.
Monitor an infrastructure with Netdata Cloud
We designed Netdata Cloud to help you see health and performance metrics, plus active alarms, in a single interface. Here's what a small infrastructure might look like:

Read more about Netdata Cloud to better understand how it gives you real-time visibility into your entire infrastructure, and why you might consider using it.
Next, get started in 5 minutes, or read our connection to Cloud reference for a complete investigation of Cloud's security and encryption features, plus instructions for Docker containers.
Navigate between dashboards with Visited nodes
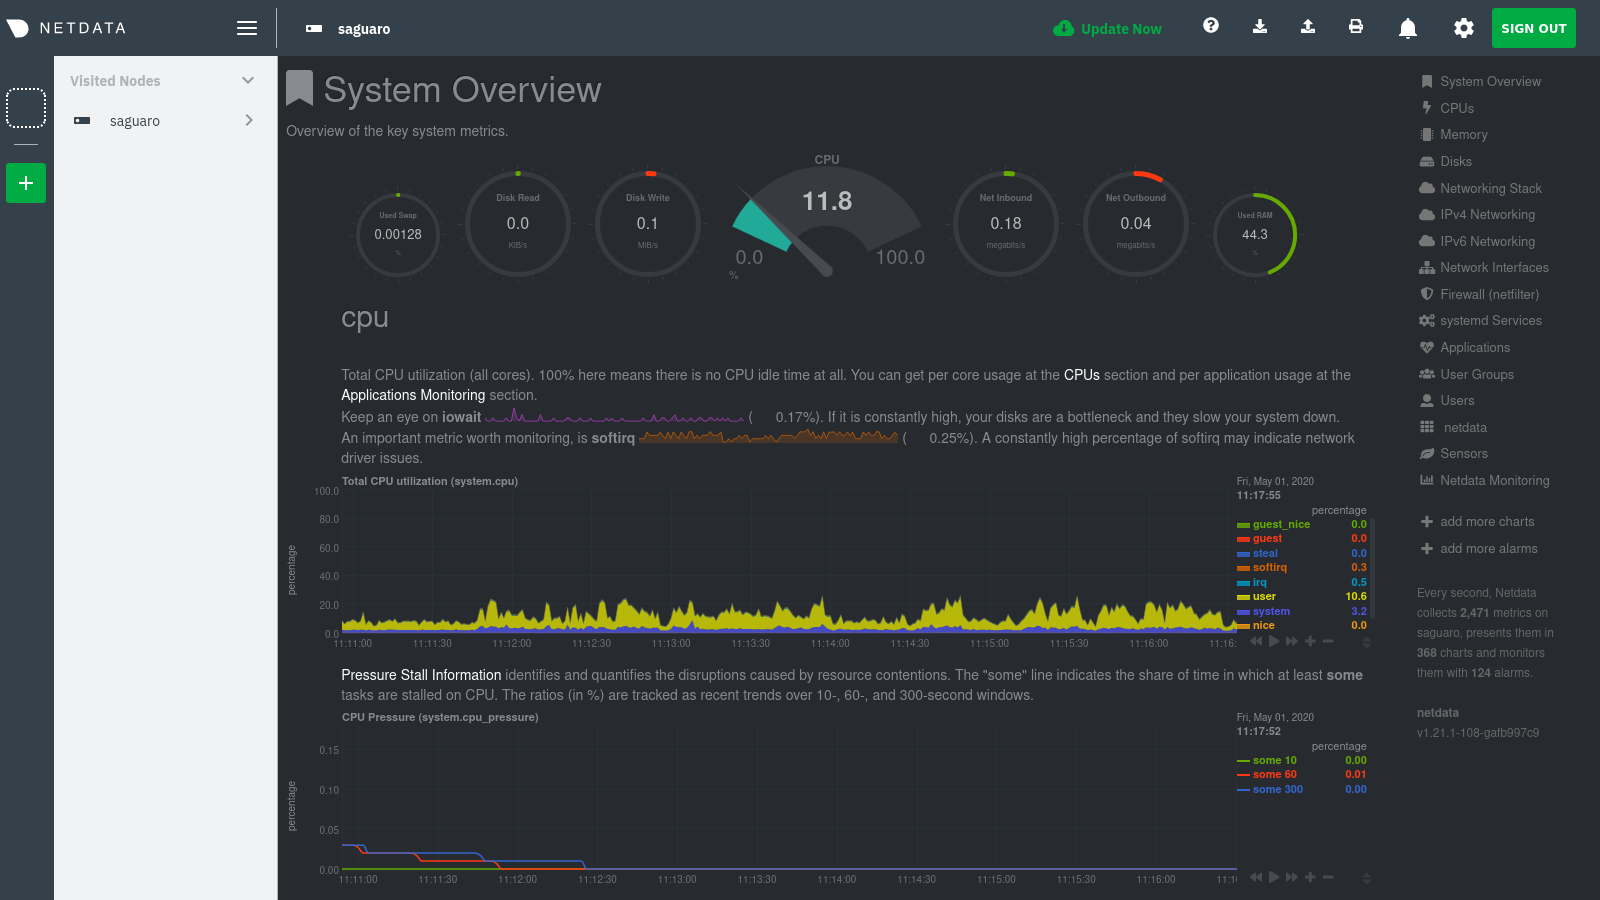
If you don't want to use Netdata Cloud's web interface, you can still connect multiple nodes through the Visited nodes menu, which appears on the left-hand side of the dashboard.
You can use the Visited nodes menu to navigate between the dashboards of many different Agent-monitored systems quickly.
To add nodes to your Visited nodes menu, you first need to navigate to that node's dashboard, then click the Sign in button at the top of the dashboard. On the screen that appears, which states your node is requesting access to your Netdata Cloud account, sign in with your preferred method.
Cloud redirects you back to your node's dashboard, which is now connected to your Netdata Cloud account. You can now see the Visited nodes menu, which is populated by a single node.
If you previously went through the Cloud onboarding process to create a Space and War Room, you will also see these in the Visited Nodes menu. You can click on your Space or any of your War Rooms to navigate to Netdata Cloud and continue monitoring your infrastructure from there.
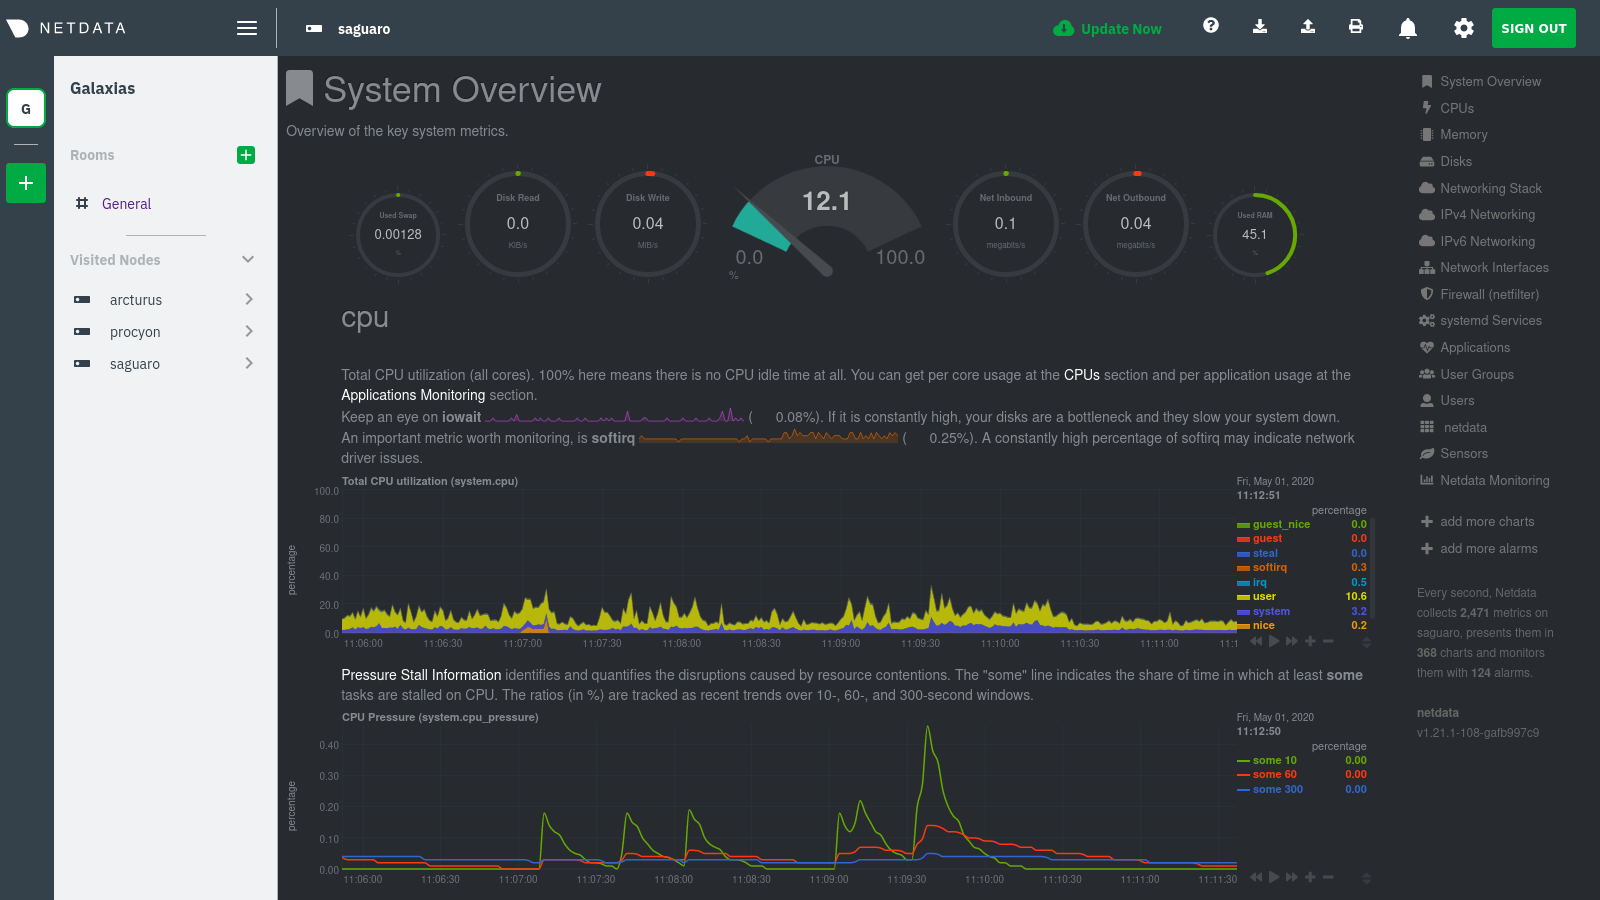
To add more Agents to your Visited nodes menu, visit them and sign in again. This process connects that node to your Cloud account and further populates the menu.
Once you've added more than one node, you can use the menu to switch between various dashboards without remembering IP addresses or hostnames or saving bookmarks for every node you want to monitor.
What's next?
The Agent-Cloud integration is highly adaptable to the needs of any infrastructure or user. If you want to learn more about how you might want to use or configure Cloud, we recommend the following:
- Get an overview of Cloud's features by reading Cloud documentation.
- Follow the 5-minute get started with Cloud guide to finish onboarding and connect your first nodes.
- Better understand how agents connect securely to the Cloud with connect agent to Cloud and Agent-Cloud link documentation.