7.6 KiB
Step 9. Long-term metrics storage
By default, Netdata stores metrics in a custom database we call the database engine, which stores recent metrics in your system's RAM and "spills" historical metrics to disk. By using both RAM and disk, the database engine helps you store a much larger dataset than the amount of RAM your system has.
On a system that's collecting 2,000 metrics every second, the database engine's default configuration will store about two day's worth of metrics in RAM and on disk.
That's a lot of metrics. We're talking 345,600,000 individual data points. And the database engine does it with a tiny a portion of the RAM available on most systems.
To store even more metrics, you have two options. First, you can tweak the database engine's options to expand the RAM or disk it uses. Second, you can archive metrics to an external database. For that, we'll use MongoDB as examples.
What you'll learn in this step
In this step of the Netdata guide, you'll learn how to:
Let's get started!
Tweak the database engine's settings
If you're using Netdata v1.18.0 or higher, and you haven't changed your memory mode settings before following this
guide, your Netdata agent is already using the database engine.
Let's look at your netdata.conf file again. Under the [global] section, you'll find three connected options.
[global]
    # memory mode = dbengine
    # page cache size = 32
    # dbengine disk space = 256
The memory mode option is set, by default, to dbengine. page cache size determines the amount of RAM, in MiB, that
the database engine dedicates to caching the metrics it's collecting. dbengine disk space determines the amount of
disk space, in MiB, that the database engine will use to store these metrics once they've been "spilled" to disk..
You can uncomment and change either page cache size or dbengine disk space based on how much RAM and disk you want
the database engine to use. The higher those values, the more metrics Netdata will store. If you change them to 64 and
512, respectively, the database engine should store about four day's worth of data on a system collecting 2,000 metrics
every second.
See our database engine calculator to help you correctly set dbengine disk space based on your needs. The calculator gives an accurate estimate based on how many child nodes you have, how many
metrics your Agent collects, and more.
[global]
    memory mode = dbengine
    page cache size = 64
    dbengine disk space = 512
After you've made your changes, restart Netdata using sudo systemctl restart netdata, or the appropriate
method for your system.
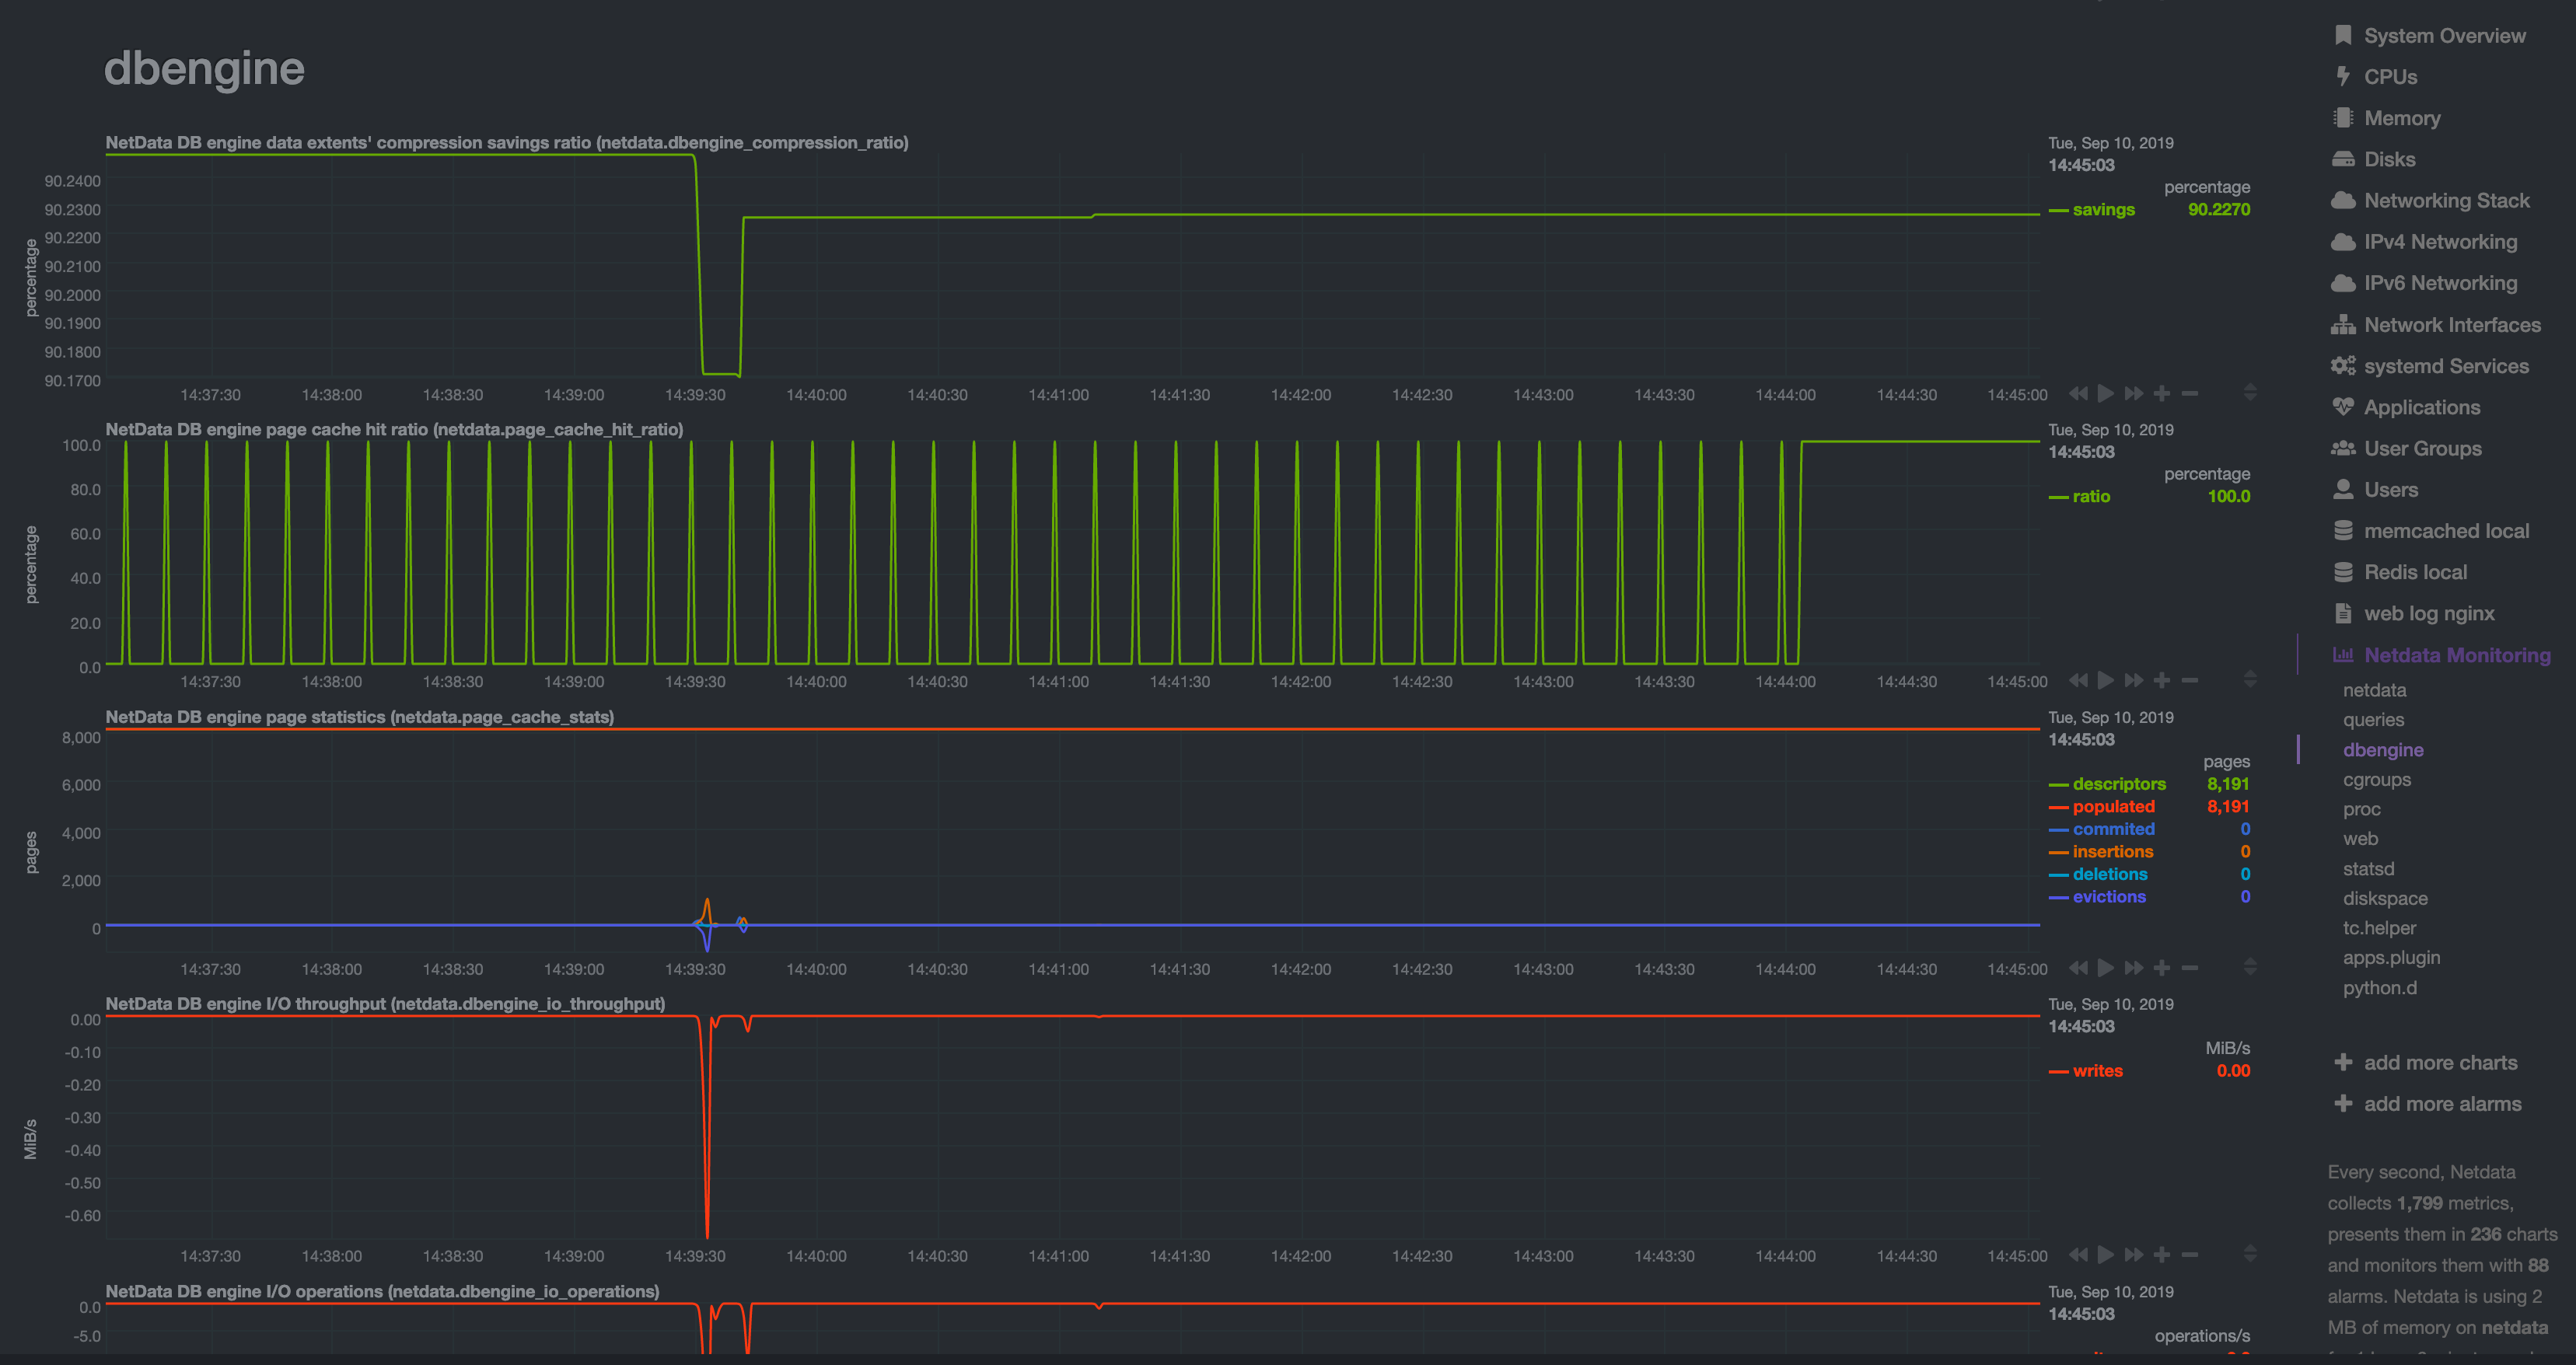
To confirm the database engine is working, go to your Netdata dashboard and click on the Netdata Monitoring menu on
the right-hand side. You can find dbengine metrics after queries.
Archive metrics to an external database
You can archive all the metrics collected by Netdata to external databases. The supported databases and services include Graphite, OpenTSDB, Prometheus, AWS Kinesis Data Streams, Google Cloud Pub/Sub, MongoDB, and the list is always growing.
As we said in step 1, we have only complimentary systems, not competitors! We're happy to support these archiving methods and are always working to improve them.
A lot of Netdata users archive their metrics to one of these databases for long-term storage or further analysis. Since Netdata collects so many metrics every second, they can quickly overload small devices or even big servers that are aggregating metrics streaming in from other Netdata agents.
We even support resampling metrics during archiving. With resampling enabled, Netdata will archive only the average or sum of every X seconds of metrics. This reduces the sheer amount of data, albeit with a little less accuracy.
How you archive metrics, or if you archive metrics at all, is entirely up to you! But let's cover two easy archiving methods, MongoDB and Prometheus remote write, to get you started.
Archive metrics via the MongoDB exporting connector
Begin by installing MongoDB its dependencies via the correct package manager for your system.
sudo apt-get install mongodb  # Debian/Ubuntu
sudo dnf install mongodb      # Fedora
sudo yum install mongodb      # CentOS
Next, install the one essential dependency: v1.7.0 or higher of libmongoc.
sudo apt-get install libmongoc-1.0-0 libmongoc-dev    # Debian/Ubuntu
sudo dnf install mongo-c-driver mongo-c-driver-devel  # Fedora
sudo yum install mongo-c-driver mongo-c-driver-devel  # CentOS
Next, create a new MongoDB database and collection to store all these archived metrics. Use the mongo command to start
the MongoDB shell, and then execute the following command:
use netdata
db.createCollection("netdata_metrics")
Next, Netdata needs to be reinstalled in order to detect that the required libraries to make this exporting connection exist. Since you most likely installed Netdata using the one-line installer script, all you have to do is run that script again. Don't worry—any configuration changes you made along the way will be retained!
bash <(curl -Ss https://my-netdata.io/kickstart.sh)
Now, from your Netdata config directory, initialize and edit a exporting.conf file to tell Netdata where to find the
database you just created.
./edit-config exporting.conf
Add the following section to the file:
[mongodb:my_mongo_instance]
    enabled = yes
    destination = mongodb://localhost
    database = netdata
    collection = netdata_metrics
Restart Netdata using sudo systemctl restart netdata, or the appropriate
method for your system, to enable the MongoDB exporting connector. Click on the
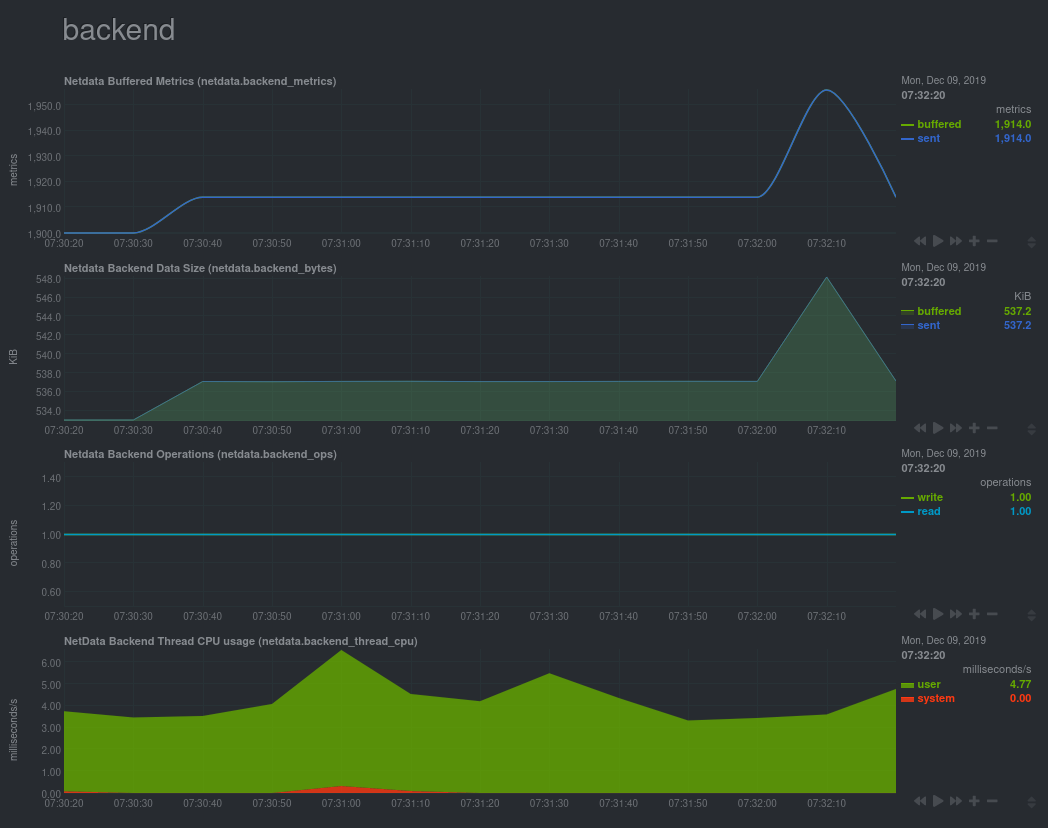
Netdata Monitoring menu and check out the exporting my mongo instance sub-menu. You should start seeing these
charts fill up with data about the exporting process!
If you'd like to try connecting Netdata to another database, such as Prometheus or OpenTSDB, read our exporting documentation.
What's next?
You're getting close to the end! In this step, you learned how to make the most of the database engine, or archive metrics to MongoDB for long-term storage.
In the last step of this step-by-step guide, we'll put our sysadmin hat on and use Nginx to proxy traffic to and from our Netdata dashboard.