|
|
||
|---|---|---|
| .travis | ||
| build | ||
| charts.d | ||
| conf.d | ||
| contrib | ||
| diagrams | ||
| hooks | ||
| installer | ||
| m4 | ||
| makeself | ||
| node.d | ||
| packaging | ||
| plugins.d | ||
| profile | ||
| python.d | ||
| src | ||
| system | ||
| tests | ||
| web | ||
| .codacy.yml | ||
| .codeclimate.yml | ||
| .csslintrc | ||
| .eslintignore | ||
| .eslintrc | ||
| .gitignore | ||
| .travis.yml | ||
| CMakeLists.txt | ||
| CONTRIBUTORS.md | ||
| ChangeLog | ||
| Dockerfile | ||
| Dockerfile.aarch64 | ||
| Dockerfile.alpine | ||
| Dockerfile.armv7hf | ||
| LICENSE | ||
| Makefile.am | ||
| README.md | ||
| REDISTRIBUTED.md | ||
| autogen.sh | ||
| configs.signatures | ||
| configure.ac | ||
| coverity-scan.sh | ||
| cppcheck.sh | ||
| docker-build.sh | ||
| kickstart-static64.sh | ||
| kickstart.sh | ||
| netdata-installer.sh | ||
| netdata.cppcheck | ||
| netdata.spec.in | ||
| package.json | ||
README.md
netdata 


New to netdata? Here is a live demo: http://my-netdata.io
netdata is a system for distributed real-time performance and health monitoring. It provides unparalleled insights, in real-time, of everything happening on the system it runs (including applications such as web and database servers), using modern interactive web dashboards.
netdata is fast and efficient, designed to permanently run on all systems (physical & virtual servers, containers, IoT devices), without disrupting their core function.
netdata runs on Linux, FreeBSD, and MacOS.

User base
Docker pulls


Since May 16th 2016 (the date the global public netdata registry was released):
![]()
![]()
![]()
in the last 24 hours:
![]()
![]()
![]()
News
Mar 27th, 2018 - netdata v1.10.0 released!
- new web server, a lot faster and more secure
- updated all javascript libraries to their latest versions (fixed compatibility issues - now netdata chart can now be embedded on Atlassian Confluence pages and remain fully interactive!)
- new plugins:
- BTRFS (visualize BTRFS allocation with alarms)
- bcache (monitor hybrid setups HDD + SSD)
- ceph
- nginx plus
- libreswan (monitor the traffic of IPSEC tunnels)
- traefik
- icecast
- ntpd
- httpcheck (monitor any remote web server)
- portcheck (monitor any remote TCP port)
- spring-boot (monitor java spring-boot apps)
- dnsdist
- Linux hugepages
- improved plugins:
- statsd
- web_log
- cgroups for containers and VMs monitoring (netdata now supports systemd-nspawn and kubernetes - fixed security issue with
cgroup-network) - Linux memory
- diskspace
- network interfaces
- postgres
- rabbitmq
- apps.plugin (now it also tracks swap usage per process)
- haproxy
- uptime
- ksm (kernel memory debupper)
- mdstat (software raid)
- elasticsearch
- apcupsd
- dhcpd
- fronius
- stiebeletron
- new alarm notification methods
- alerta
- IRC (post on IRC channels)
- and dozens more improvements, enhancements, features and compatibility fixes
Features

-
Stunning interactive bootstrap dashboards
mouse and touch friendly, in 2 themes: dark, light -
Amazingly fast
responds to all queries in less than 0.5 ms per metric, even on low-end hardware -
Highly efficient
collects thousands of metrics per server per second, with just 1% CPU utilization of a single core, a few MB of RAM and no disk I/O at all -
Sophisticated alerting
hundreds of alarms, out of the box!
supports dynamic thresholds, hysteresis, alarm templates, multiple role-based notification methods (such as email, slack.com, flock.com, pushover.net, pushbullet.com, telegram.org, twilio.com, messagebird.com, kavenegar.com) -
Extensible
you can monitor anything you can get a metric for, using its Plugin API (anything can be a netdata plugin, BASH, python, perl, node.js, java, Go, ruby, etc) -
Embeddable
it can run anywhere a Linux kernel runs (even IoT) and its charts can be embedded on your web pages too -
Customizable
custom dashboards can be built using simple HTML (no javascript necessary) -
Zero configuration
auto-detects everything, it can collect up to 5000 metrics per server out of the box -
Zero dependencies
it is even its own web server, for its static web files and its web API -
Zero maintenance
you just run it, it does the rest -
scales to infinity
requiring minimal central resources -
several operating modes
autonomous host monitoring, headless data collector, forwarding proxy, store and forward proxy, central multi-host monitoring, in all possible configurations. Each node may have different metrics retention policy and run with or without health monitoring. -
time-series back-ends supported
can archive its metrics ongraphite,opentsdb,prometheus, json document DBs, in the same or lower detail (lower: to prevent it from congesting these servers due to the amount of data collected)

What does it monitor?
netdata collects several thousands of metrics per device. All these metrics are collected and visualized in real-time.
Almost all metrics are auto-detected, without any configuration.
This is a list of what it currently monitors:
-
CPU
usage, interrupts, softirqs, frequency, total and per core, CPU states -
Memory
RAM, swap and kernel memory usage, KSM (Kernel Samepage Merging), NUMA -
Disks
per disk: I/O, operations, backlog, utilization, space, software RAID (md)
-
Network interfaces
per interface: bandwidth, packets, errors, drops
-
IPv4 networking
bandwidth, packets, errors, fragments, tcp: connections, packets, errors, handshake, udp: packets, errors, broadcast: bandwidth, packets, multicast: bandwidth, packets -
IPv6 networking
bandwidth, packets, errors, fragments, ECT, udp: packets, errors, udplite: packets, errors, broadcast: bandwidth, multicast: bandwidth, packets, icmp: messages, errors, echos, router, neighbor, MLDv2, group membership, break down by type -
Interprocess Communication - IPC
such as semaphores and semaphores arrays -
netfilter / iptables Linux firewall
connections, connection tracker events, errors -
Linux DDoS protection
SYNPROXY metrics -
fping latencies
for any number of hosts, showing latency, packets and packet loss
-
Processes
running, blocked, forks, active -
Entropy
random numbers pool, using in cryptography -
NFS file servers and clients
NFS v2, v3, v4: I/O, cache, read ahead, RPC calls -
Network QoS
the only tool that visualizes networktcclasses in realtime
-
Linux Control Groups
containers: systemd, lxc, docker -
Applications
by grouping the process tree and reporting CPU, memory, disk reads, disk writes, swap, threads, pipes, sockets - per group
-
Users and User Groups resource usage
by summarizing the process tree per user and group, reporting: CPU, memory, disk reads, disk writes, swap, threads, pipes, sockets -
Apache and lighttpd web servers
mod-status(v2.2, v2.4) and cache log statistics, for multiple servers -
Nginx web servers
stub-status, for multiple servers -
Tomcat
accesses, threads, free memory, volume -
web server log files
extracting in real-time, web server performance metrics and applying several health checks -
mySQL databases
multiple servers, each showing: bandwidth, queries/s, handlers, locks, issues, tmp operations, connections, binlog metrics, threads, innodb metrics, and more -
Postgres databases
multiple servers, each showing: per database statistics (connections, tuples read - written - returned, transactions, locks), backend processes, indexes, tables, write ahead, background writer and more -
Redis databases
multiple servers, each showing: operations, hit rate, memory, keys, clients, slaves -
couchdb
reads/writes, request methods, status codes, tasks, replication, per-db, etc -
mongodb
operations, clients, transactions, cursors, connections, asserts, locks, etc -
memcached databases
multiple servers, each showing: bandwidth, connections, items -
elasticsearch
search and index performance, latency, timings, cluster statistics, threads statistics, etc -
ISC Bind name servers
multiple servers, each showing: clients, requests, queries, updates, failures and several per view metrics -
NSD name servers
queries, zones, protocols, query types, transfers, etc. -
PowerDNS
queries, answers, cache, latency, etc. -
Postfix email servers
message queue (entries, size) -
exim email servers
message queue (emails queued) -
Dovecot POP3/IMAP servers
-
ISC dhcpd
pools utilization, leases, etc. -
IPFS
bandwidth, peers -
Squid proxy servers
multiple servers, each showing: clients bandwidth and requests, servers bandwidth and requests -
HAproxy
bandwidth, sessions, backends, etc -
varnish
threads, sessions, hits, objects, backends, etc -
OpenVPN
status per tunnel -
Hardware sensors
lm_sensorsandIPMI: temperature, voltage, fans, power, humidity -
NUT and APC UPSes
load, charge, battery voltage, temperature, utility metrics, output metrics -
PHP-FPM
multiple instances, each reporting connections, requests, performance -
hddtemp
disk temperatures -
smartd
disk S.M.A.R.T. values -
SNMP devices
can be monitored too (although you will need to configure these) -
chrony
frequencies, offsets, delays, etc. -
beanstalkd
global and per tube monitoring -
ceph
OSD usage, Pool usage, number of objects, etc.
And you can extend it, by writing plugins that collect data from any source, using any computer language.
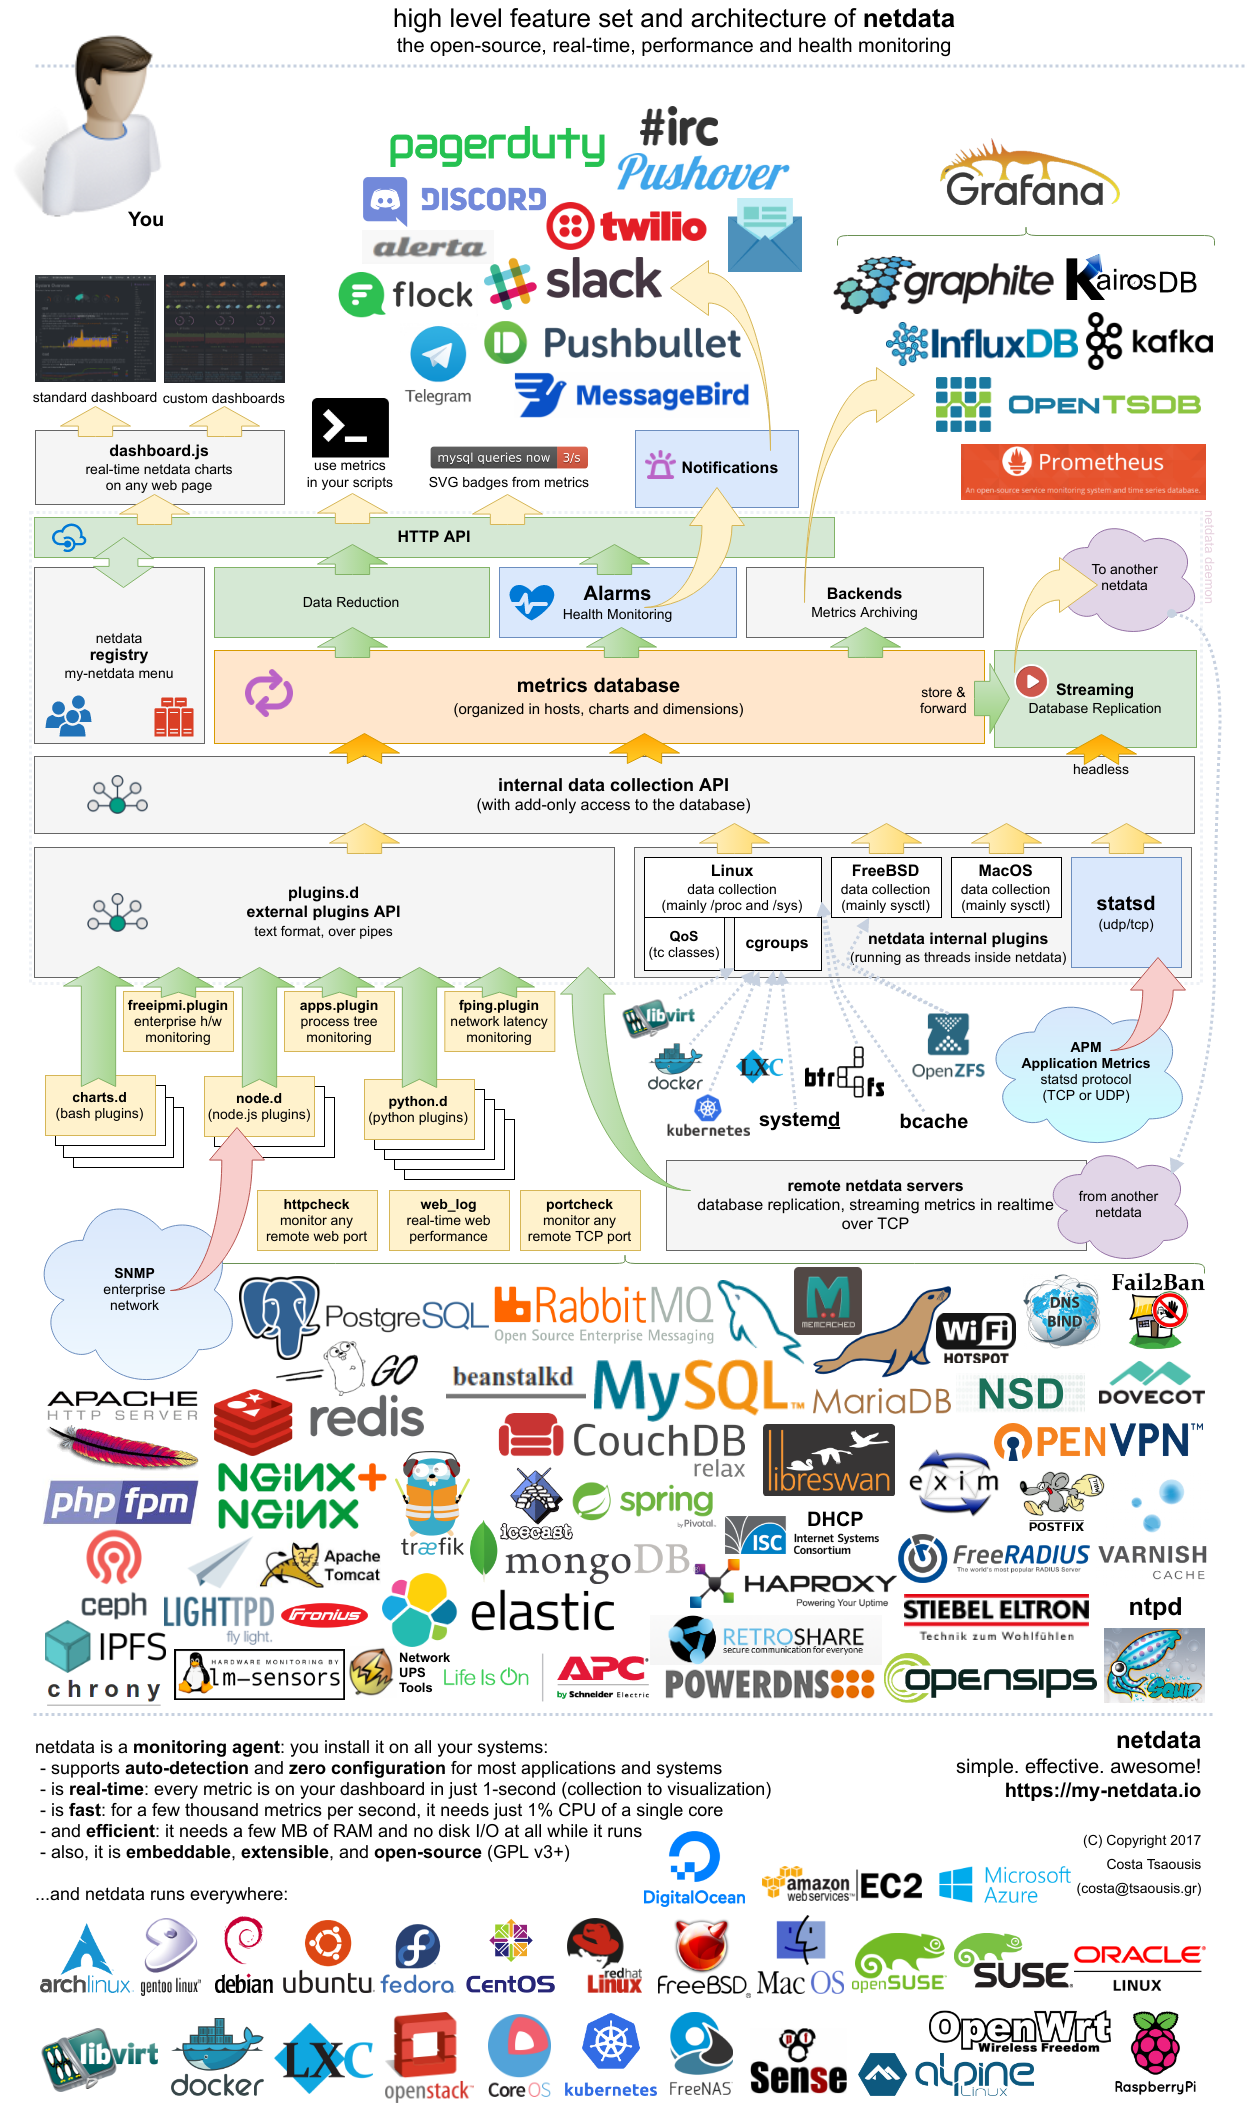
netdata infographic
This is a high level overview of netdata feature set and architecture. Click it to to interact with it (it has direct links to documentation).
Installation
Use our automatic installer to build and install it on your system.
It should run on any Linux system (including IoT). It has been tested on:
- Alpine
- Arch Linux
- CentOS
- Debian
- Fedora
- Gentoo
- openSUSE
- PLD Linux
- RedHat Enterprise Linux
- SUSE
- Ubuntu
Interaction with netdata
After installation, you can interact with netdata using CLI and web dashboards. The default port of dashboard is 19999. To access the web dashboard on localhost, use: http://localhost:19999
Documentation
Check the netdata wiki.
License
netdata is GPLv3+.
Netdata re-distributes other open-source tools and libraries. Please check the third party licenses.